
See American printing from Drupa 2024
I. Analysis the data
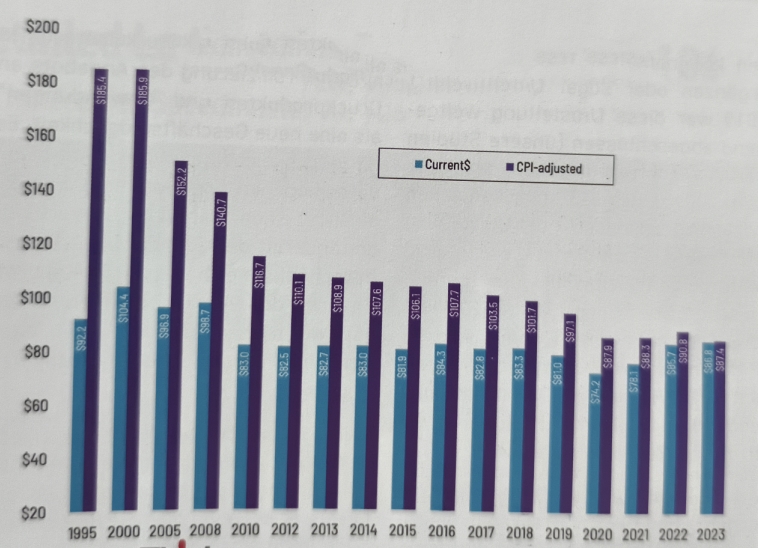
As I visitor of Drupa 2024, I have to say that America got some pushback, but it ended up being eerily prescient. Indeed, the value of printing shipments (i.e., revenues/turnover) in 2000 wereUS$186 billion. As 2023 wrapped up, shipments for the year came in at US$87 billion(all these numbers are inflation-adjusted to 2023). So in 23 years the commercial printing industry lost US$100 billion in value. It’s no surprise why-the advent of the internet, the fast proliferation of broad-band and WiFi, then mobile technology all shifted many print applications to electronic media, and fast Internet speeds, especially on mobile devices, increased the number of things one could do online, such as watch videos, stream programming, etc. This is a very old story, but we sometimes forget it, especially as mobile speeds continue to increase (5G is still in the process of proliferating, but in Japan, 6G has been success-fully demonstrated)-further increasing the number of things we can do online.
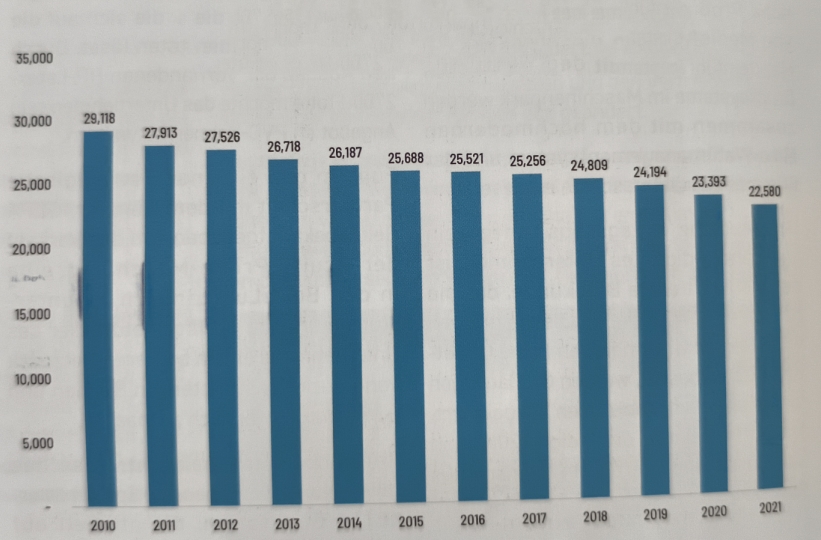
Likewise, we have also seen a steady decline in commercial printing establishments. According to County Business Patterns-published annually by the US Census Bureau-in 2021, there were 22,580 establishments in NAICS 323.
II. See the future
Now, at least in the US, there can be a fundamental problem with tracking industry data through the government. “NAICS” stands for “North American Industry Classification System” and is the standard used by Federal statistical agencies in classifying business establishments. All the government data we track is from NAICS 323-Printing and Related Activities, the broadest classification of printing, prepress, and post press establishments. However, not all businesses that we would consider printing today-or, more importantly, what those businesses would consider printing-are classified in 323. Sign manufacturers, for example, are largely in NAICS 339. Sign lettering and painting are classified in NAICS 541. Manufacturing and printing advertising specialties are classified in the Manufacturing sector according to the products made. Manufacturing die-cut paperboard displays are classified in NAICS 322. Packaging converters are in 322. You get the picture. And then there are print businesses that took to heart the exhortation in the 2010s to become “marketing services providers” and classify themselves in a marketing or communications NAICS. The point is, we may be under representing the US printing industry- although our own surveys have found that NAICS 323 is still the most valid way of analyzing the industry.
All that out of the way, over the past 10- 15 years, even as demand for commercial print products has declined new types of print have increased in demand. The 2000s saw the emergence of affordable and high-quality display graphics printers, both roll fed and flatbed, and the 2010s saw
The industry (and other market segments like photo labs) adopting “wide-format” printing technologies, either to complement or even replace commercial print operations. By 2019,that migration was largely over (our studies have repeatedly found that about 30% of the US
Commercial printing industry steadfastly resist the wide-format migration), although the pandemic lockdowns of 2020 spurred a lot of print businesses to “pivot” to wide-for-mat applications to produce the COVID- related signage and other graphics that emerged in that period.
As the display graphics migration ended-and to some extent display graphics became commoditized-printers have been starting to look for new areas to expand into. In What They Think’s Fall 2023 Business Outlook Survey, 25% of print businesses cited “diversifying print product/application offerings” as a new business opportunity. However, it’s not entirely clear what those diverse offerings are. For some, packaging is one, for others, some kind of “industrial” printing is alluring. Industry pundits have cited strong opportunities in textile printing, but we have yet to see that really catch on.
III. Conclusion
It’s easy to look at industry demographics and see nothing but doom and gloom, but it’s best to think of the industry as right-sizing” itself. Today’s- and tomor-rows-printing industry is stronger than it had been during the 2000s and 2010s (especially after the Great Recession of 2008), when there had been waves of consolidation. Sure, it’s smaller, but the businesses in it are healthier. Ultimately, the number of establishments and level of revenues in any industry in any market is a function of the level of demand for what that industry produces. At the end of the day, there really is no trend more important than the fundamental demand for print in the marketplace. It doesn’t matter whether digital or analog printing predominates, it doesn’t matter how productive our workflows are, it doesn’t matter if we have the greatest sales people in the world. If there is no demand for what we as an industry produce, business will be bad and we will lose establishments, So it’s more imperative than ever to understand what kinds of print are in demand and to understand that that may very well change in a heartbeat.
Enjoyed reading this, very good stuff, appreciate it.